Alright, it’s been 13 days since I let the test run it’s course. I could go into some elaborate thinking behind why I let almost 2 weeks go by – I wanted to see results, bla bla bla, but realistically I was lazy and pretty scared I might screw up these numbers with further testing. I mean doubling your conversion is quite a feat, so again the paralyzing of being scared of failure came into play – even with all the knowledge I know about split testing. You have to keep forging even in the mist of the fear. If I didn’t forge forward I would not have doubled my conversion rate in 9 days of split testing. “Fear is why you fail”. So far there have been 29 sales this month – including the two from early this morning. To put things into perspective last month I had only 14 sales, with this split test and letting it run it’s course, I’ve doubled my sales and revenue! Current running number:
May 13 to May 31:
Orders: 12 sales
Landing Page Visits: 5,743
Conversion Rate: 0.002090%
Revenue: $348.29June 1 to June 30:
Orders: 17 sales
Landing Page Visits: 11,734
Conversion Rate: 0.001448%
Revenue: $400.28July 1 to July 31:
Orders: 6 sales
Landing Page Visits: 5,215
Conversion Rate: 0.001150%
Revenue: $151.07August 1 to August 31:
Orders: 14 sales
Landing Page Visits: 6,576
Conversion Rate: 0.002128%
Revenue: $357.37September 1 to September 29:
Orders: 29 sales
Landing Page Visits: 8,992
Conversion Rate: 0.003225%
Revenue: $720.32
The conversion rate has increased, but again remember, we did run the test, so the Original lander that sucked is pulling down the overall number. I suspect it’s really at .004% since mathematically it makes sense when comparing it to August’s numbers. Basically I know the floor for my product is set at .003% minimum going forward. To get an idea of the conversion rate increases, I’ve made a nice fancy-pants chart of the last 7 day average conversions. I had to do it this way, since there are days with zero conversions, and it would not allow you to see the whole picture. So each data point is the average of the last 7 day’s conversions (since I get an average of a sale a day, but some days there are 3 sales and some with 0):
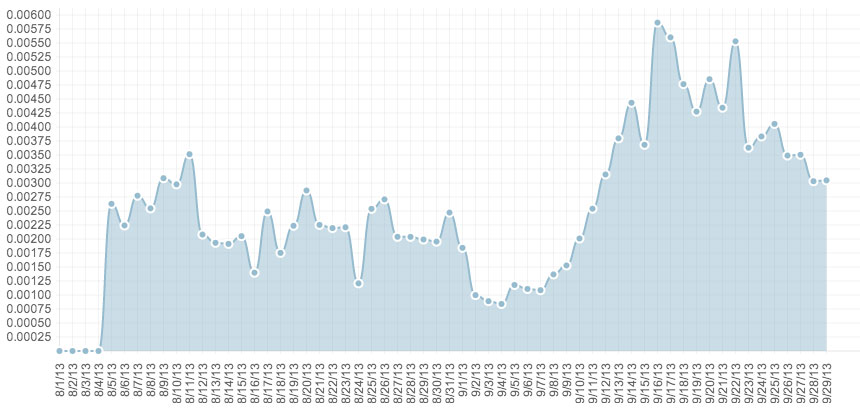
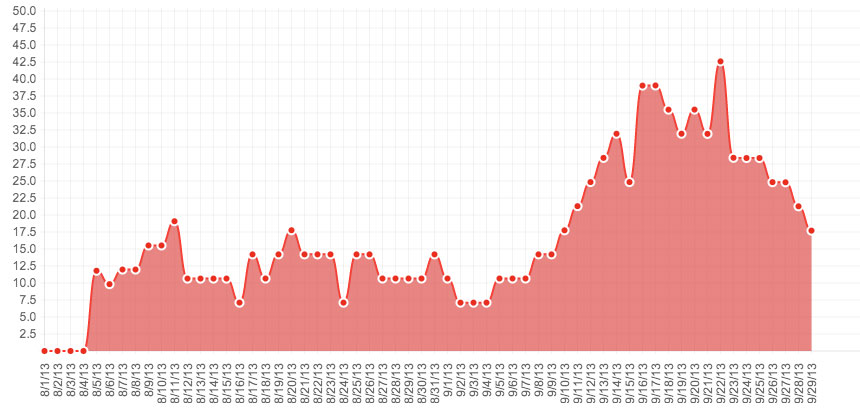
You can clearly see the day where we started testing and the resulting increase in conversion. That right there should give you enough confidence in doing your own test cause even something as simple as new content can make a HUGE difference. Here is the 7 Day Average in terms of revenue. Before the test I was at $7 to $11 daily revenue (averaged for past 7 days), After the test I’m averaging $17 to $28 daily average (averaged for past 7 days). Basically double the money 🙂
I consider my first test a huge success, and am going to start on my 2nd test later on today. Being able to double your revenue with free software is crazy to say the least. If you actually take the time to set everything up correctly, 1-2 hours at most, and let it ride, it’s almost impossible for you to NOT make money! The free software has paid for their next month’s fees and then some. I’m going to continue this case study of course – tune in next time! (Probably tomorrow)
Update: Another sale today, that’s 3 so far 😀